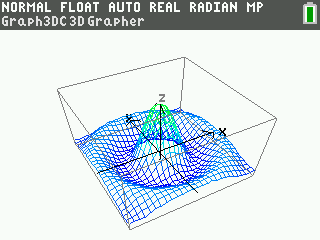
Graph3CE: 3D Graphing for the TI-84 Plus CE
Enabling 3D graphing on graphing calculators has been one of my long-running fascinations. From early monochrome TI-BASIC experiments dating to at latest 2002, to C and z80 assembly 3D graphing applications for color-screen graphing calculators, they have been a constant thread woven through my hobby software development. With the release of the TI-84 Plus CE in 2015, I inevitably hoped to be able to port a 3D graphing program to it, although I was torn between two options that would each allow me to build on my previous work.
One option was to port my TI-84 Plus C Silver Edition project Graph3DC. This 3D grapher was completed in 2016, less than a year after release of the TI-84 Plus CE, the replacement for the TI-84 Plus C Silver Edition. This ambitious project aimed to create a 3D equivalent to TI’s Inequality Graphing application: 3D graphing that is well-integrated with the TI-OS. Working from the community’s documentation on OS hooks and my previous experience with them in Doors CS, I beat my head against the many bugs and missing hook features to allow 3D graphing with equation entry, a Trace feature, Window and Zoom editing, horizontal and vertical splitscreen, and overall to seamlessly sit side-by-side with the TI-OS’s 2D graphing. The project was sufficiently complex, and I was sufficiently aware of the number of people who would use it (especially for the already obsolete TI-84 Plus C Silver Edition) versus how many hours I invested in it, that I didn’t think continuing that development direction for the TI-84 Plus CE was the right choice.
The other option was to port my Casio Prizm project Graph3DP. Completed a year after Graph3DC, it had several properties that made it a more attractive option than Graph3DC for porting. It was written as a standalone program running on top of the operating system, rather than integrating with the OS, which made the focus of the program writing a good 3D grapher, rather than figuring out the intricacies of the OS’s undocumented interfaces. It was written in C instead of a lower-level language, which would accelerate development, especially with a great C toolchain and set of libraries being created by the calculator hobbyist community. For both better and worse, it also is built with its own equation parser or as TI calls it, Equation Operating System, gCAS2, created by Cemetech member AHelper2. This was imperative for the Casio Prizm, which does not expose its EOS to user programs. On the TI-84 Plus CE, it is potentially extraneous, as you can access the OS’s own EOS from C and assembly programs, but the TI-OS’s EOS can occasionally be slow or cumbersome.
For speed and simplicity, I elected to choose the second option, and base Graph3CE on the C-language Graph3DP for the Casio Prizm. I expected fewer changes would be required than for porting Graph3DC from the TI-84 Plus CE: z80 and ez80 assembly, and the memory and system calls available between the TI-84 Plus C Silver Edition and TI-84 Plus CE, are quite different. Since the C toolchain exists for the TI-84 Plus CE, porting Graph3DP would require swapping out some library calls and adapting to a slightly different screen size, but would otherwise be simple. I began development of Graph3CE in July 2017, by taking the Graph3DP source code and adding preprocessor directives to conditionally toggle code and constants depending on whether the code was being built for the TI-84 Plus CE or the Casio Prizm. The goal was to be able to build the same codebase for either the TI or Casio calculators: although I haven’t released a new Prizm version, I maintained the Prizm code throughout the development of the TI-84 Plus CE version.
From October 2024 until January of this year, I made steady progress, from an initial proof-of-concept port, to optimizing, to a significant cleanup of original Prizm code to be better modularized and thus easier to maintain. Major stops along the way include:
-
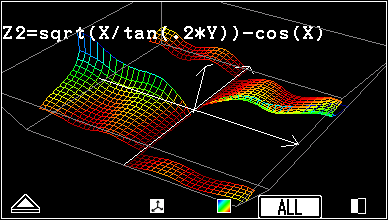
Translated the 16-bit colors used on the Casio Prizm to approximate colors in the 8-bit “xLIBC” color palette:
-
Switched to custom color palettes, allowing graph re-coloring with a simple palette switch instead of recomputation:
-
Refactored code used for graphing and tracing, allowing both rotating graphs and tracing over graphs to be faster, and permitting tracing from any perspective, not just top down:
-
Fixed a variety of bugs in gCAS2 (and the C toolchain math functions), including problems with single-digit constants, variables, transcendental functions, and pi.
-
Added (generous) limits to the lengths of entered equations:
I published three beta versions between the end of November 2024 and January 2025, which the community very helpfully tested, finding a few additional bugs. Between January and June 2025, work and life obligations largely prevent me from making forward progress on the project, but in late June I published a final beta, and the next day, released Graph3DC v2.0. Features of this released version include:
- Graph, explore, rotate, and zoom up to 6 3D equations
- Zoom and set the graph window from Zoom and Window menus
- Trace graphs to explore the z values for (x, y) coordinates on graph surfaces
- Graph in multiple color modes, on light or dark backgrounds, with or without axes and a bounding box
- Fast graph calculation with gCAS2
Download it on Cemetech:


